
New SearchStax Managed Search service users often ask us why their new deployment shows 90% physical memory usage.
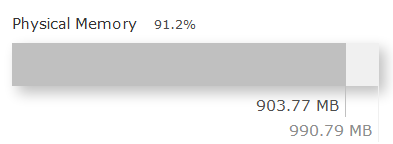
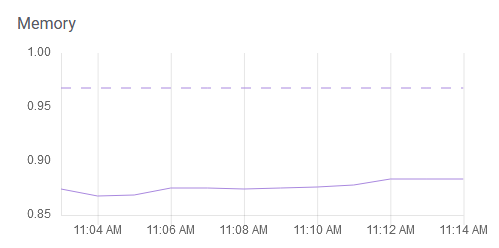
These images were taken from a SearchStax NDN1 single-node deployment before any client configuration or data ingestion.
An NDN1 deployment is a small node for configuration testing. Clients use these nodes for proof-of-concept demos. The great virtue of the NDN1 is that it is inexpensive and disposable. You can run it for less than $1.50/day on the pay-as-you-go plan, and you can terminate it at will. An NDN1 isn’t meant to handle large data sets, a high commit rate, or a high query load.
In a NDN1, the solr JVM occupies half of the server’s total memory. Solr may reserve additional memory for utility tasks related to index building. The operating system and other processes, including Zookeeper, share the remaining memory.
If the physical memory on the box hits 100%, the swap space on the server will start to be used. The server will not run out of memory unless the physical memory and swap memory both approach 100%.
However, if the Solr JVM usage reaches 100%, the Solr process will stop. For Azure or Google Cloud deployments, SearchStax will restart Solr automatically. For a deployment on AWS, you can use the Stop Solr/Start Solr links on the deployment details page to restart Solr. If you have any difficulty, contact the SearchStax Support Desk. We’ll restart Solr for you and help you understand your options.
See the following pages for more information:
Questions?
Do not hesitate to contact the SearchStax Support Desk.