A Search – Avg. Response Time/Request alert is a Threshold Alert that notifies you by email when your SearchStax Managed Search service deployment has been taking more than some number of seconds to respond to queries over a period of some minutes. This creates an Incident in the Managed Search Dashboard.
Sluggish searches need to be investigated. Nobody likes to wait for results.
System Load is Too High
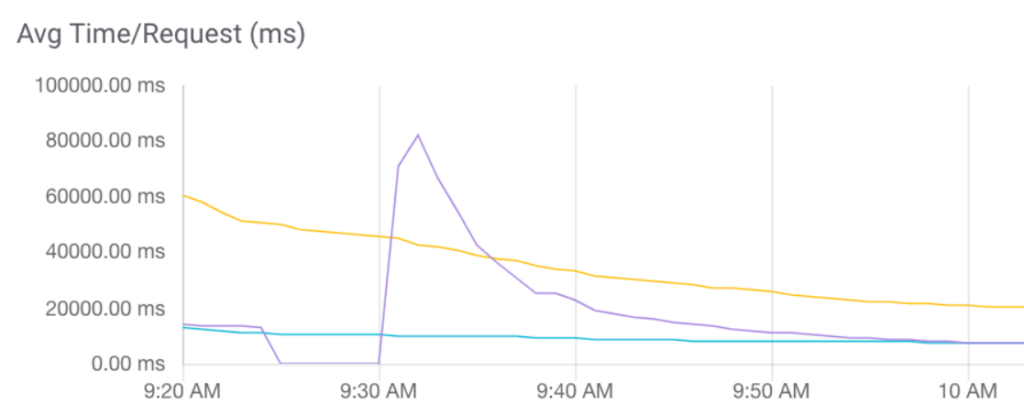
Search – Avg. Response Time/Request alerts can result when the system is under heavy stress, as shown by elevated CPU and System Load graphs. Check the System Load/CPU graphs to evaluate the load. Also, check the Service Graph to see if there is a spike.
This is often associated with a heavy episode of indexing. If the alerts are associated with indexing events, consider throttling back the flow of /update messages.
This situation can be relieved by performing a rolling restart. Contact SearchStax Support if you need any help there.
Request Volume is Too High
It is possible for a cluster to become too busy handling search events, such as during a holiday spike in traffic. Evaluate if the number of timeouts is decreasing and one should just wait, else open a ticket with SearchStax support.
If Search – Avg. Response Time/Request alerts become a persistent or chronic problem, consider adding a node to your cluster. Search requests are resolved in parallel across all available nodes.
Questions?
Do not hesitate to contact the SearchStax Support Desk.