Email Alerts
Overview
The SearchStax Managed Search service provides two kinds of real-time email alerts:
- Heartbeat alerts: Notify a list of email recipients when a server starts or stops operating.
- Threshold alerts: Notify a list of email recipients when a server exceeds a performance threshold.
Either type of alert may optionally invoke a webhook to notify an external bug-tracking system or alerting system.
Both types of alerts create an “incident” report that you can inspect in the SearchStax Managed Search dashboard.
Alerts send a follow-up email when the condition is resolved.
Heartbeat Alerts on All Servers
SearchStax automatically adds Heartbeat Alerts to all new Solr Cloud servers — both Solr and Zookeeper.
The alerts send email to all users any time the server is silent for five full minutes. A second email is sent when the server becomes active again.
Four Threshold Alerts on Solr Servers
SearchStax automatically configures four standard alerts on all new Solr nodes. Account users are notified by email when:
- Search Timeouts exceed 10 in 5 minutes
- JVM Heap Memory exceeds 80% for 5 minutes
- Index Error Count exceeds 10 in 5 minutes
- Disk Space Used exceeds 80% for 5 minutes
Premium Alerting
For SearchStax customers with Premium Support Level Agreements (SLAs), we have an internal monitoring system that notifies our on-call support team of any issues.
Contents of this page:
Popular Alerts
SearchStax customers often implement some or all of the following alerts on a production system:
| Alert | Node | Trigger | Delay | Max Alerts | Repeat |
|---|---|---|---|---|---|
| Heartbeat | All | – | 5 min | 1 | 15 min |
| CPU Usage | Solr | >80% | 5 min | 1 | 15 min |
| Free Disk Space | Solr | <20% | 5 min | 1 | 15 min |
| JVM Heap Used | Solr | >80% | 5 min | 1 | 15 min |
| Index Error Count * | Solr | >10 | 5 min | 1 | 15 min |
| Index Timeout | Solr | >10 | 5 min | 1 | 15 min |
| Index Average Response Time / Request | Solr | >60000 | 5 min | 1 | 15 min |
| Search Timeouts | Solr | >10 | 5 min | 1 | 15 min |
| Search Average Response Time / Request | Solr | >3000ms | 5 min | 1 | 15 min |
* Note that index-error alerts often mean that some of your documents have been dropped from the index. See What Causes Indexing Errors?
Alerts for Query Errors
Clients who are concerned about Search Errors sometimes add these two threshold alerts in addition to the standard alerts in the previous section:
| Alert | Node | Trigger | Delay | Max Alerts | Repeat |
| 1 Min. 5XX Error Rate | Solr | > 1 | 5 min | 1 | 15 min |
| Search Error Count | Solr | > 10 | 5 min | 1 | 15 min |
The 1 Min. 5XX Error Rate may alert you to query syntax errors (among other issues). These queries are rejected by Solr. Check your Solr log files. The Search Error Count responds to syntactically-correct queries that have schema errors such as unknown fields. As with all threshold alerts, you will have to experiment to find settings you can live with.
Heartbeat Alerts
Both Zookeeper and Solr send reports of system metrics to SearchStax once per minute. You can set up a “heartbeat” alert to notify you if these reports are interrupted. The system also notifies you when the updates resume.
Set up a Heartbeat Alert
To set up a heartbeat alert, open the SearchStax Managed Search dashboard.
- Click the Dedicated Infrastructure label in the left-side navigation menu.
- Select a Deployment.
- Open the Alerting menu.
- Select Heartbeat.
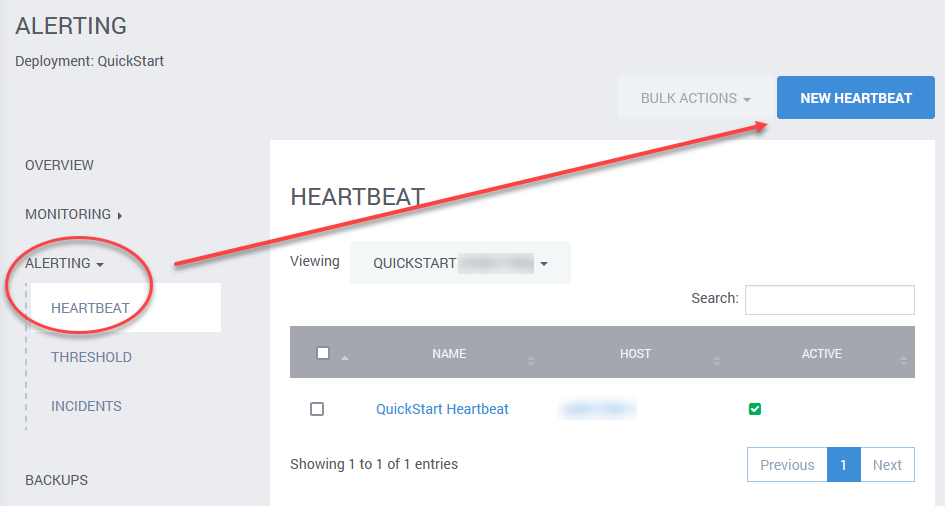
- To create a new Heartbeat Alert, click the New Heartbeat button.
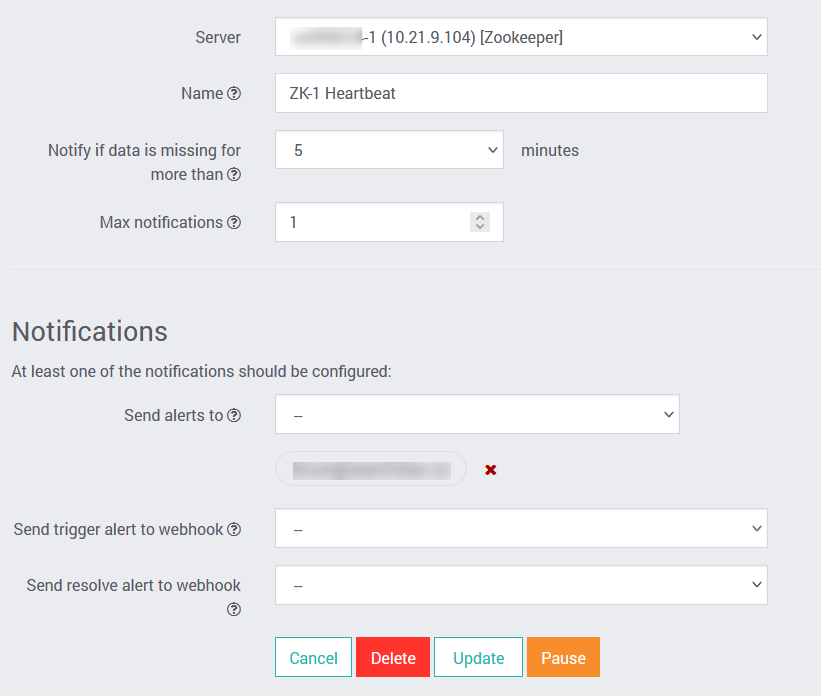
| Control | Description |
|---|---|
| Server | The Server control offers a list of the servers in this deployment. Select one of them to monitor. |
| Name | Give the alert a name that you will recognize when you see it in email. |
| Notify if data is missing for more than… | When heartbeat data stops flowing, wait this long before triggering the alert. |
| Max Notifications | Alert emails are reissued every two minutes. How many of them do you want to send? |
| Send alerts to | Choose from a list of registered SearchStax users. |
| Send trigger alert to webhook | Invoke this webhook when this alert is triggered. |
| Send resolve alert to webhook | Invoke this webhook when the alert is resolved. |
Heartbeat Email
A heartbeat email notification resembles this one:
Dear SearchStax Customer,

The alert ss123456-5 heartbeat alert for your deployment Films (ss123456) has been triggered.

The following host is unreachable.

Host: ss123456-5

To View Metrics in Dashboard: https://app.searchstax.com/admin/deployment/pulse/deployment/ss123456/alert/incident/update/65737

To Edit this Alert: https://app.searchstax.com/admin/deployment/pulse/deployment/ss123456/alert/heartbeat/update/841/

This alert was triggered at 2020-01-15 20:12:27 UTC.

This alert was raised for account AccountName.
You will receive a similar “UP” notification when the heartbeat is again detected.
Threshold Alerts
A “threshold” alert watches a specific system metric and sends you email when the metric meets or exceeds some value.
Managed Search allows you to monitor the following metrics:
- Total Requests – can be applied to the App Gateway server only.
- CPU Usage
- JVM Thread Count
- Disk Space Used
- Disk Space Free
- JVM Heap Memory Used
- 1 Min. 5XX Error Rate
- Swap Used
- System Load Average
- Search – Avg. Requests/s
- Search – 5 Min. Request Rate
- Search Timeouts
- Search Error Count
- Index – Timeouts
- Index – Error Count
- QueryResultCache – evictions
- QueryResultCache – warmupTime
- QueryResultCache – hit ratio
- Filtercache – evictions
- Filtercache – warumpTime
- Filtercache – hit ratio
- DocumentCache – evictions
- DocumentCache – hit ratio
- DocumentCache – warmupTime
- FieldValueCache – evictions
- FieldValueCache – hit ratio
- FieldValueCache – warmupTime
- Search – Avg. Response Time/Request (ms)
- Index – Avg Response Time/Request (ms)
- JVM Non-Heap Memory Used
- Physical Memory Used
- Index – 5 min. Request Rate
Set up a Threshold Alert
To set up a threshold alert, open the SearchStax Managed Search dashboard and navigate to a specific deployment.
- Click the Dedicated Infrastructure label in the left-side navigation menu.
- Select a Deployment.
- Open the Alerting menu.
- Select Threshold.
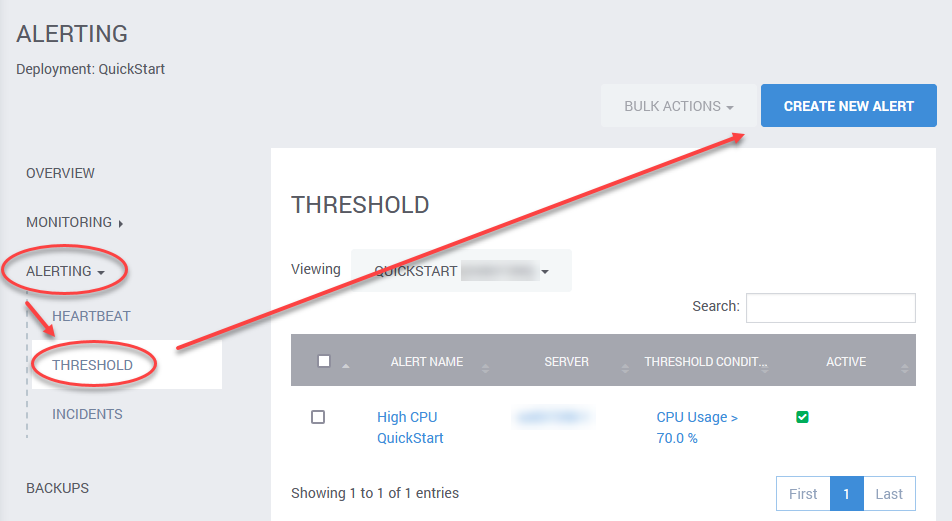
- To create a new Threshold Alert, click the Create New Alert button.
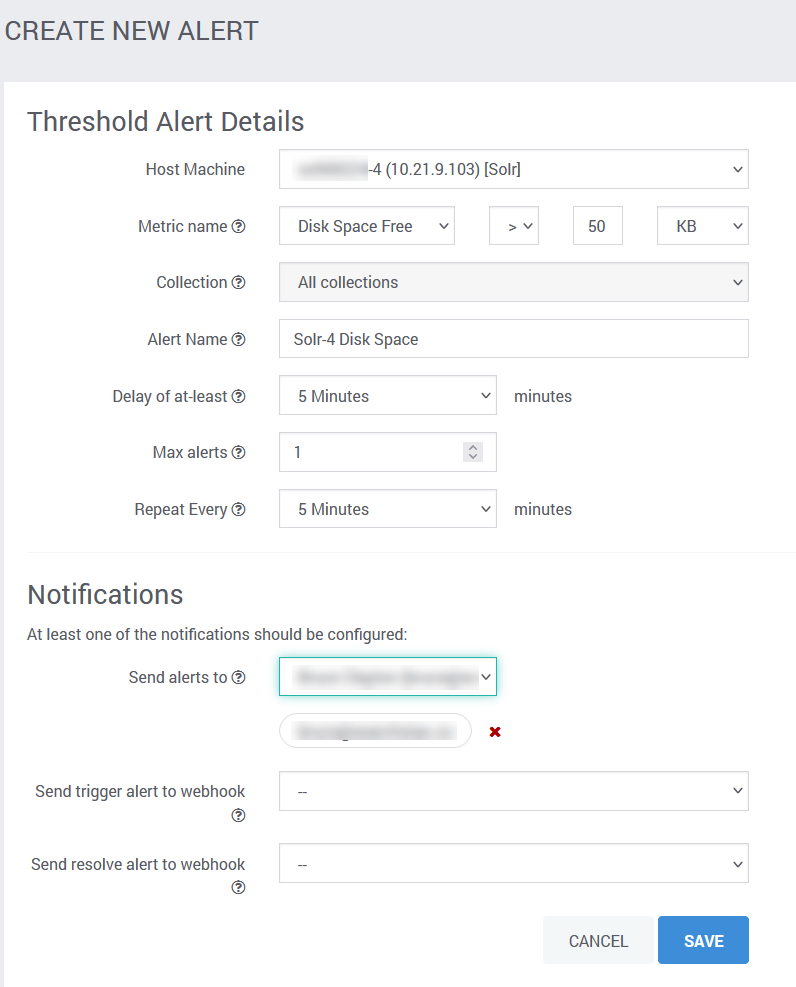
| Control | Description |
|---|---|
| Host Machine | The Host Machine control offers a list of the servers in this deployment. Select one of them to monitor. |
| Metric Name | Choose one of many internal metrics monitored by Managed Search. |
| Collection | Some metrics are collection-specific. Others apply to “all collections.” |
| Alert Name | Give the alert a name that you will recognize when you see it in email. |
| Delay of at least | Metric must exceed threshold for this long before triggering the alert. |
| Max Alerts | Alert emails are reissued every two minutes. How many of them do you want to send? |
| Repeat Every | Time to wait between sending repeat email messages. |
| Send alerts to | Choose from a list of registered SearchStax users. |
| Send trigger alert to webhook | Invoke this webhook when this alert is triggered. |
| Send resolve alert to webhook | Invoke this webhook when the alert is resolved. |
Receive a Threshold Alert
A threshold email notification resembles this one:
Dear SearchStax Customer,

The alert "Server 5 below 10% CPU" for your deployment Films (ss123456) has been triggered.

Host:           ss123456-5
Metric:         CPU Usage
Name:           "Server 5 below 10% CPU"
Threshold:      < 10.0%
Current Value:  0.01 %

To View Metrics in Dashboard: https://app.searchstax.com/admin/deployment/pulse/deployment/ss123456/system/

To Edit this Alert: https://app.searchstax.com/admin/deployment/pulse/deployment/ss123456/alert/incident/update/6012

This alert was triggered at 2019-12-20 17:51:42 UTC.

This alert was raised for account AccountName.
Incidents
To view a list of your heartbeat or threshold incidents:
- Click the Dedicated Infrastructure label in the left-side navigation bar.
- Select a Deployment from the list.
- Open the Alerting menu.
- Select Incidents.
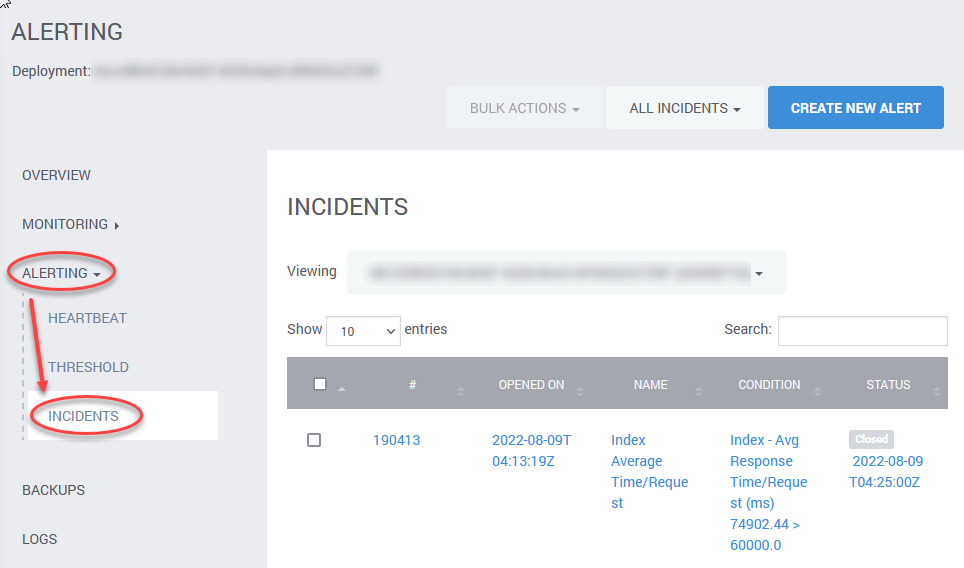
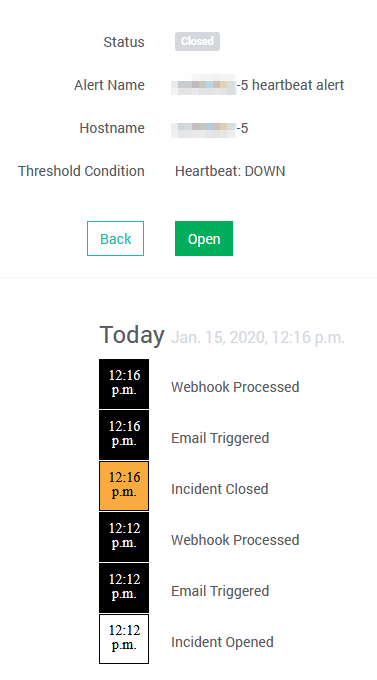
Click the incident to view its details. You’ll see a brief description of the incident followed by a timeline of events. Read the timeline from the bottom up.
Opting Out
Not everyone wants to receive email alerts. If you have users who find the alerts annoying, they can opt out.
Each alert has its own list of recipients. If someone complains about a specific alert, you can remove them from that alert’s notification list. Alternately, you could raise the alert threshold, or increase the alert’s activation time. Either action should reduce the number of complaints about email alerts.
Questions?
Do not hesitate to contact the SearchStax Support Desk.

