Feb. 18, 2024
Dipsy Kapoor
|
SearchStax Managed Search is a managed Solr-as-a-Service solution that makes it easy to set up, manage and maintain Apache Solr. Solr is an open-source enterprise-search platform from Apache Lucene Project which is written in Java.
One issue with Java applications is that they sometimes encounter out of memory errors, and this is a common issue with Solr deployments too. When Solr runs out of memory, we intuitively expect that the index is too large or the application is overwhelmed by a very high indexing rate. Although these issues are common, they might not be the real or the only reasons.
Below we look at how you can recognize a Solr Out-of-Memory (OOM) issue, and explore the top four reasons why your Solr deployment might throw an OOM Exception and what you can do to resolve the errors.
How Do I Recognize a Solr Out-of-Memory Error?
Your server stopped unexpectedly. Was it an out-of-memory error?
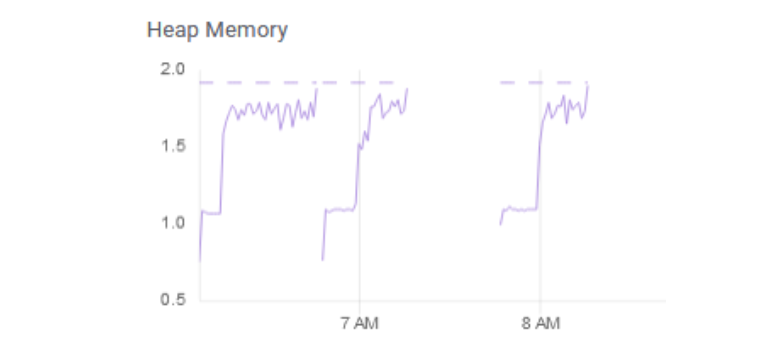
If you’re using SearchStax Managed Search, you can open the Monitoring display and view the Heap Memory graph. If the memory reached the top of the graph and then crashed, it’s probably an out-of-memory situation.

The list of log files will show an oom-killer log. The name of the file includes the time stamp of the crash. Note that the file list in SearchStax Managed Search is updated only once per hour, so the log might not appear there right away.

OOM Reason #1 – Requesting a large number of rows
Out-of-Memory Issue:
Queries requesting a large number of rows can run the system out of memory.
When investigating performance issues in client deployments, we often see that the queries are asking for more than a million rows! Although Solr might not return that many documents, it internally allocates memory for the number of results that the query requested.
Out-of-Memory Solution:
You should configure your application to request only the number of rows that you are showing in the search results. Even if you are using faceting, requesting for only 10 or 20 rows will still compute the facets over the entire resultset.
OOM Reason #2 – Queries starting at a large page number
Out-of-Memory Issue:
Queries starting at a large page number use unexpected amounts of memory. A similar performance issue happens when the queries do deep pagination by having a large start parameter. Solr needs to fetch all results up to the value of the start parameter, resulting in heavy memory utilization.
Out-of-Memory Solution:
If your application cannot be restructured to avoid deep pagination, to fetch larger results, you can use “Cursors”. You can learn more about them at the Solr Pagination Documentation.
OOM Reason #3 – Faceting, sorting and grouping queries
Out-of-Memory Issue:
Faceting, sorting and grouping queries use a lot of memory, especially if done on fields that are not docValues. In general, faceting, sorting and grouping queries are expensive, having high memory utilization. Setting docValues=true in the schema field definition reduces the java heap requirements by memory-mapping field data.
Out-of-Memory Solution:
If you are having out-of-memory issues, you should investigate the fields that are being used for faceting, grouping, and sorting, and make sure that their schema sets docValues=true.
(Note: If you change a docValues setting in the schema, you’ll have to reindex your content.)
Reason #4 – Large Caches – QueryResultCache, DocumentCache, FilterCache, FieldCache
Out-of-Memory Issue:
Caching makes Solr fast and reliable by trading speed for memory. Large caches could be one of the reasons behind your out-of-memory problems.
There are different kinds of caches that are configured in solrconfig.xml:
- filterCache: This is the cache storing unordered lists of document ids that have been returned by the “fq” (filterQuery) parameter of your queries.
- queryResultCache: This cache stores document ids returned by searches
- documentCache: This caches fieldValues that have been defined as “stored” in the schema, so that Solr does not have to go back to the index to fetch and return them for display.
- fieldCache: This cache is used to store all of the values for a field in memory rather than on to disk. For a large index, the fieldCache can occupy a lot of memory, especially if caching many fields.
The settings for each cache defines its initial size, its max size, and its autowarmcount – which is the number of items that are copied over from an old searcher to the new one.
Out-of-Memory Solution:
Looking at Plugins/Stats in the Solr dashboard, you can check the hit ratio of the caches to see if they are being utilized. If the hit ratio is too low, the caches are not really being utilized. You can make the caches smaller to reduce the memory footprint.
Also, if the number of evictions is too large, chances are the cached entries are being tossed without being used. You might just benefit by reducing the cache sizes to relieve your out-of-memory problems.
You should also note that these caches are per core/collection. The memory requirements will be multiplied by the number of collections. If your application uses a large set of collections, the memory impact of caching will be magnified.
How To Add More Memory to Solr Deployment
If you are using SearchStax Managed Search to host your Solr deployments and need more memory, see how you can upgrade your SearchStax deployment.
Trust SearchStax to Manage Solr for You
Let us solve the technical aspects of your Solr infrastructure. You don’t have to go it alone trying to implement these best practices. Have a conversation with one of our Solr experts to discover how we can make that burden easier to manage.
SearchStax Managed Search is a fully-managed SaaS solution that automates, manages, maintains and scales Solr search infrastructure in public or private clouds. We take care of Solr and make sure you have a reliable, secure and compliant Solr setup so you can focus on more value-added tasks.
Schedule a demo or start a free trial to see how SearchStax Managed Search can make it easier to manage and maintain Solr.


